All weekly Forex analysis are high-level and sets the week ahead. However markets change due to news and events so this may evolve. I do Monthly, weekly and daily scans every week for context. Higher TF help to guide the lower so as to give an indication or hint as to the direction of the market and potential entry points. I try to focus on price action and use indicators secondarily for probability of reversals or change in market sentiment.
Charts shown do not necessarily mean that I will be entering them, however I will observe for potential opportunities as they’re either a setup being played or about to be played.
As per our disclaimer – This is not financial advice but for educational purpose only
21 SMA = RED
55 SMA = ORANGE
200 SMA = YELLOW
Bollinger Bands = PURPLE
MACD (prefer to use in non-trending market)
RSI (prefer to use in non-trending market)
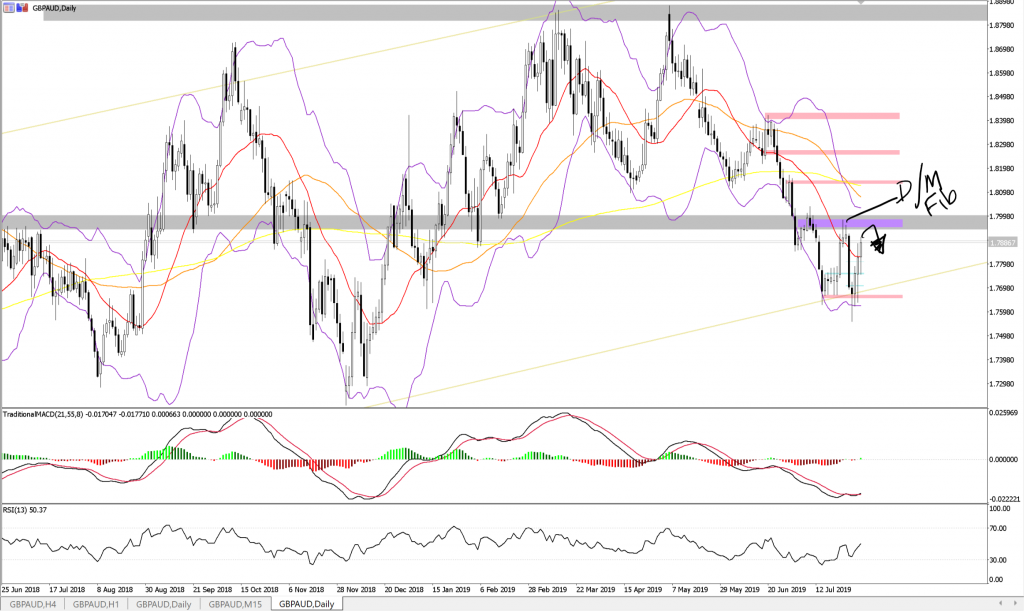
GBPAUD – Bearish
W1: Price tested ascending trend line (gold) and daily fib zone (purple) twice in consecutive weeks nut weakened at previous highs
W1: 200SMA as resistance as same area as weekly Fib zone
D1: Price approaching daily and monthly Fib zone as resistance, so expecting sell orders to trigger – Look for bearish candle patterns
H4: Price approaching 200MA where has been rejected previously – Look for bearish candle patterns nearby

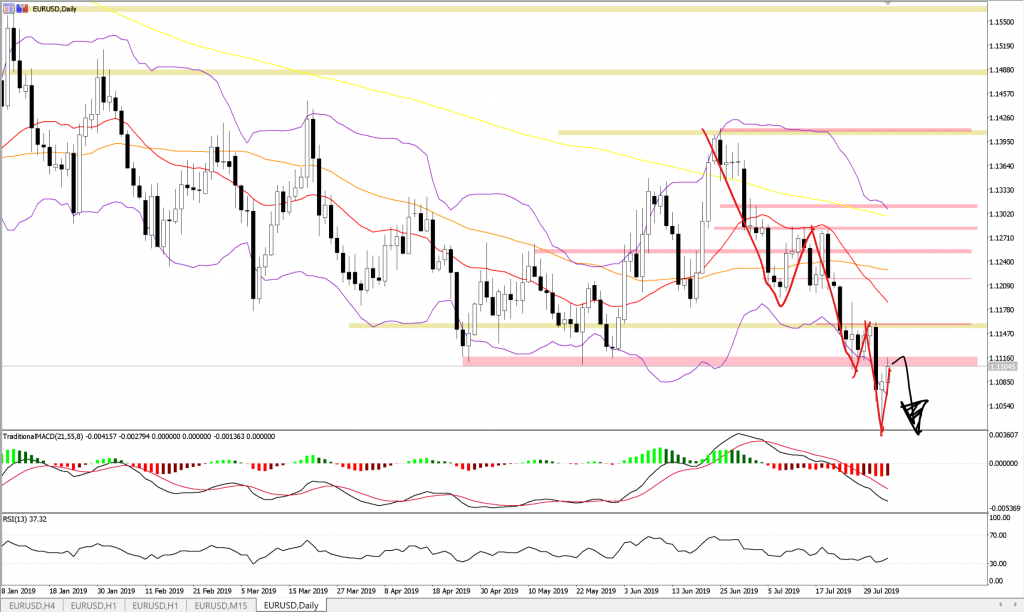
EURUSD – Bearish
W1: Trend is down
D1: Price descending pulling back at fib levels
D1 Price broke support area turning to resistance
D1: Price pulling back to resistance area which also a daily fib zone
H4: Bearish harami candle pattern inside resistance area

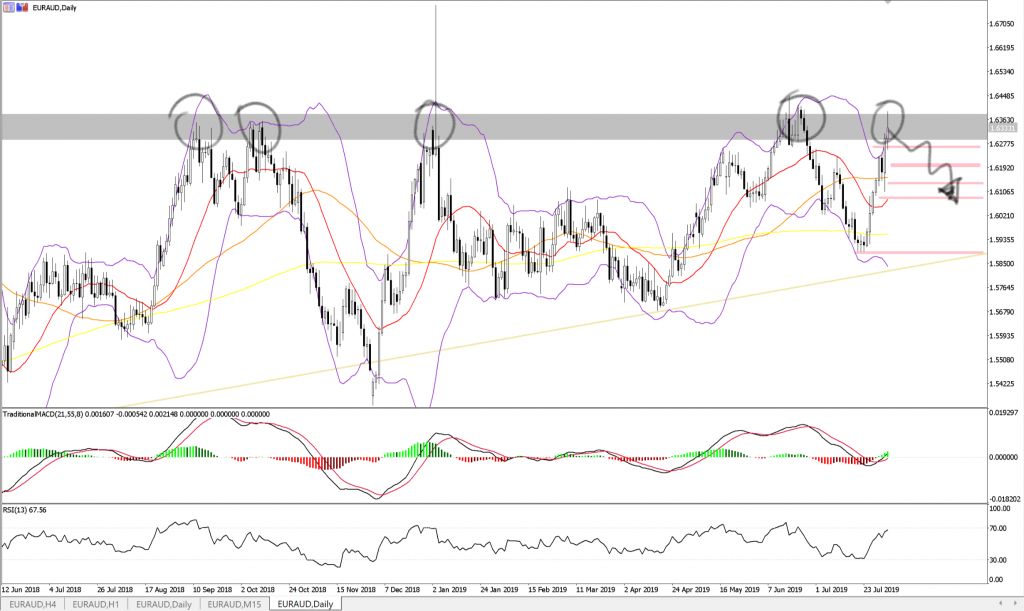
EURAUD – Bearish
M1: Price in monthly resistance area
W1: Price in weekly resistance area
D1: High wave candle (long upper/lower wicks) in resistance area – signifying indecision
D1: Price at top of Bollinger Band
H4: Bearish pin bar followed by doji each with lower highs

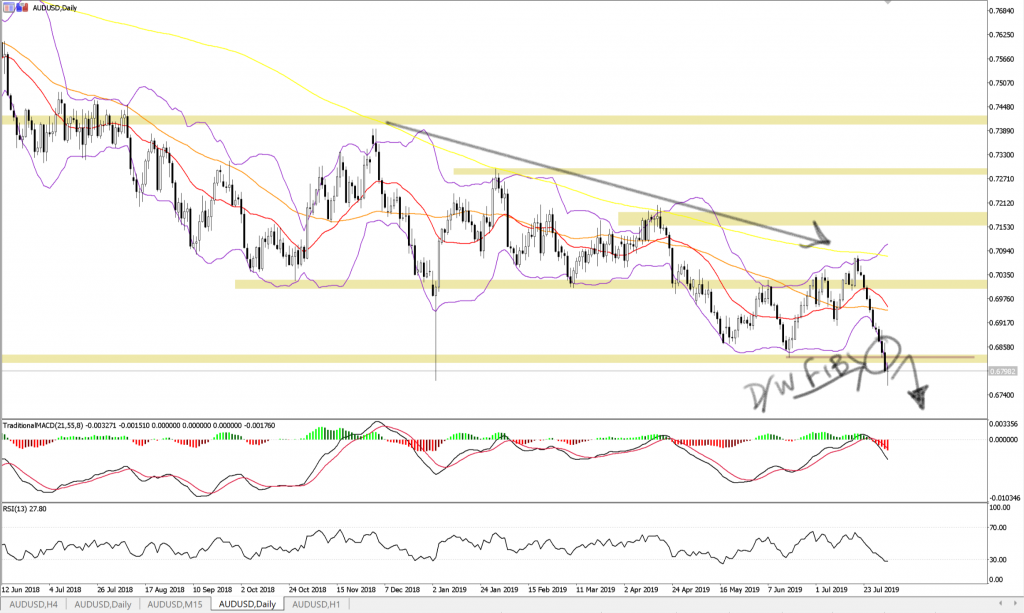
AUDUSD – Bearish
W1: Trend is down
W1: Price broken below horizontal support
W1: Support is also Fib area for Weekly and Daily
D1: Price below
D1: Price undecided signified by doji.
D1: expecting pullback to new resistance and then sell off
H4: Moving averages in down trending order (20 < 50 < 200)
H4: Bullish pin bar candle followed by bullish engulfing – heading toward new resistance.. Look for bearish patterns in that area


You must be logged in to post a comment.