All weekly Forex analysis are high-level and sets the week ahead. However markets change due to news and events so this may evolve. I do Monthly, weekly and daily scans every week for context. Higher TF help to guide the lower so as to give an indication or hint as to the direction of the market and potential entry points. I try to focus on price action and use indicators secondarily for probability of reversals or change in market sentiment.
Charts shown do not necessarily mean that I will be entering them, however I will observe for potential opportunities as they’re either a setup being played or about to be played.
Disclaimer: This is not financial advice but for educational purposes ONLY
21 SMA = RED
55 SMA = ORANGE
144 SMA = GOLD
Bollinger Bands = PURPLE
MACD 21/55 (prefer to use in non-trending market)
RSI (prefer to use in non-trending market)
News
At the moment I stay out of market at these times however, I keep aware of what is going on. Times are in GMT (0)
| Date | GMT 0 | Currency | |
| Mon Oct 28 | |||
| Tue Oct 29 | 6:45 | AUD | RBA Gov Lowe Speaks |
| 14:00 | USD | CB Consumer Confidence | |
| Wed Oct 30 | 0:30 | AUD | CPI q/q |
| AUD | Trimmed Mean CPI q/q | ||
| 12:15 | USD | ADP Non-Farm Employment Change | |
| 12:30 | USD | Advance GDP q/q | |
| 14:00 | CAD | BOC Monetary Policy Report | |
| CAD | BOC Rate Statement | ||
| CAD | Overnight Rate | ||
| 15:15 | CAD | BOC Press Conference | |
| 18:00 | USD | FOMC Statement | |
| USD | Federal Funds Rate | ||
| 18:30 | USD | FOMC Press Conference | |
| Thu Oct 31 | 0:00 | NZD | ANZ Business Confidence |
| 0:30 | AUD | Building Approvals m/m | |
| 1:00 | CNY | Manufacturing PMI | |
| Tentative | JPY | BOJ Outlook Report | |
| Tentative | JPY | Monetary Policy Statement | |
| Tentative | JPY | BOJ Press Conference | |
| 12:30 | CAD | GDP m/m | |
| USD | Personal Spending m/m | ||
| Fri Nov 1 | 1:45 | CNY | Caixin Manufacturing PMI |
| 12:30 | USD | Average Hourly Earnings m/m | |
| USD | Non-Farm Employment Change | ||
| USD | Unemployment Rate | ||
| 14:00 | USD | ISM Manufacturing PMI |
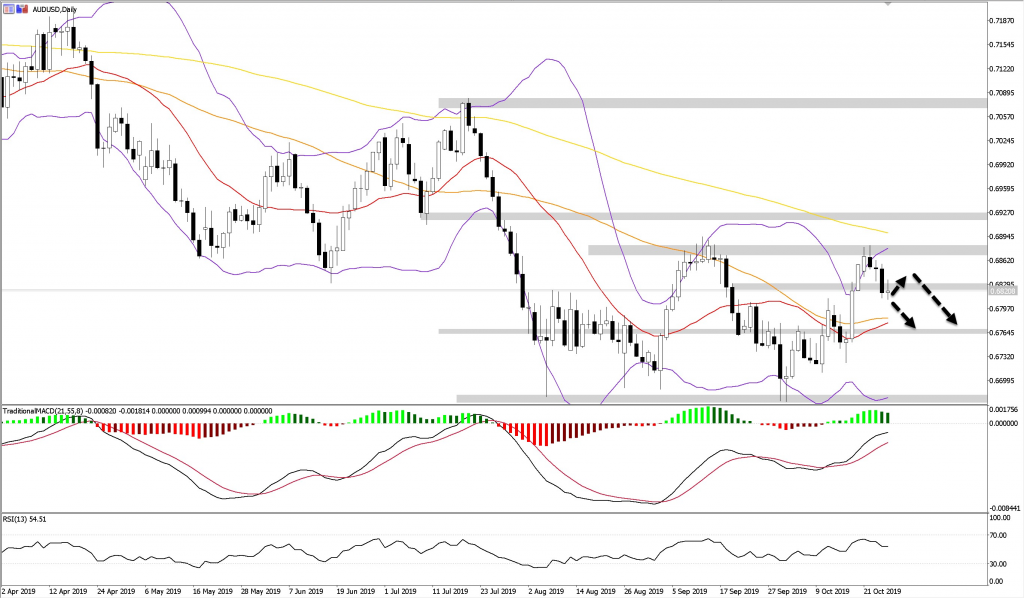
AUDUSD – Bearish
WK1: Price has closed at 23.6% fib level
WK1: Price formed bearish candle at resistance area
WK1: Price closed at/below 21 SMA
WK1: Price below moving averages in down trending order (20 < 50 < 200) which I see as technically bearish
D1: Price has rejected from previous strong resistance which is D1 50% Fib level
D1: Price closed below weekly 23.6% fib level
D1: Price closed just below 38.2% fib level
H4: Price between weekly 23.6 and daily 38.2 and weekly central pivot point – this may cause some consolidation before a break above or below
H4: Price trading below 21 SMA
H4: Price closed as doji at weekly central
H4: MACD below signal line in down trending fashion
H1: Price below moving averages in down trending order (21 < 55 < 144) which I see as technically bearish
H1: Price at resistance area

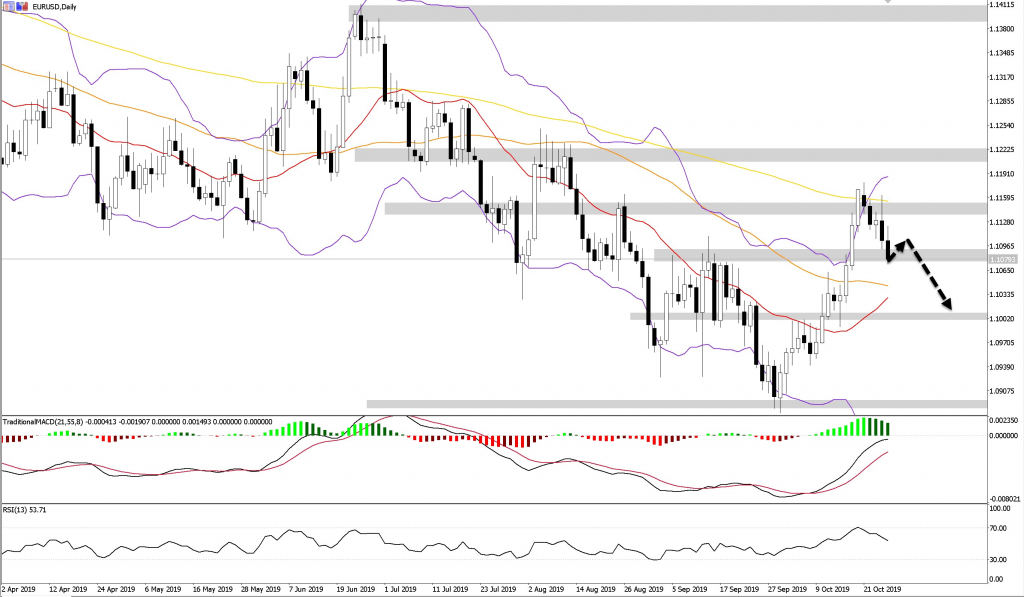
EURUSD – Bearish
WK1: Price has closed at 38.2% fib level
WK1: Price formed bearish candle at resistance area
WK1: Price closed at/below 21 SMA
WK1: Price below moving averages in down trending order (21 < 55 < 144) which I see as technically bearish
D1: Price has rejected from previous strong resistance which is 50% Fib level
D1: Price closed below weekly Central Pivot Point
D1: Price closed at D1 38.2% fib level
H4: Price closed at support with piercing line candlestick pattern
H4: 21 and 55 SMA converging for potential golden cross
H4: MACD below signal line in down trending fashion
H4: Expect up to weekly central pivot (38.3% fib level) before sell off
H1: Price below moving averages in down trending order (21 < 55 < 144) which I see as technically bearish

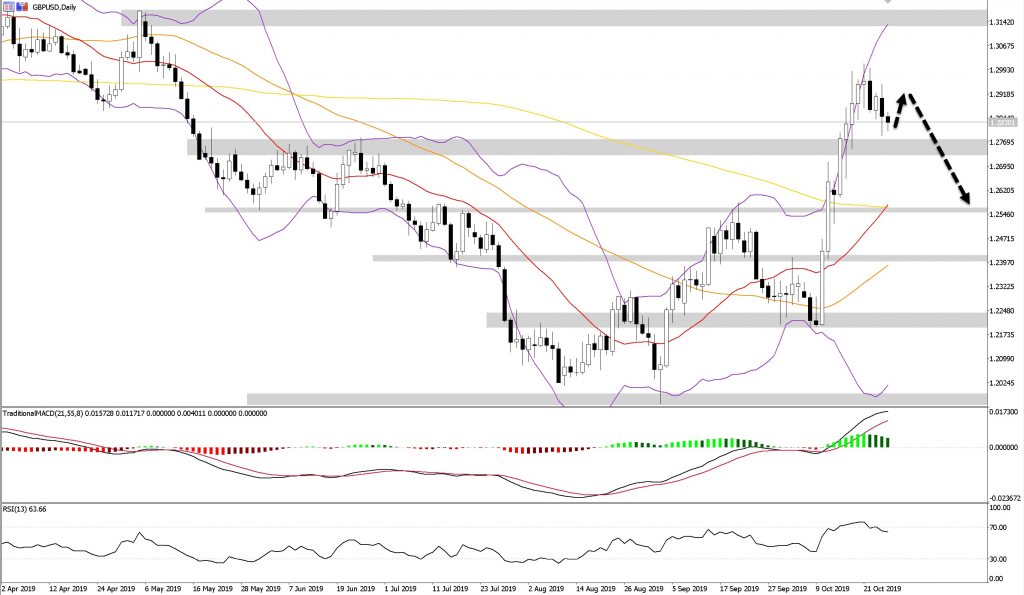
GBPUSD – Bearish
WK1: Price has closed at 38.2% fib level
WK1: 144 SMA served as dynamic resistance
WK1: Price formed bearish candle at resistance area
D1: Price has rejected at resistance from D1 76.4% and WK1 38.2% Fib level
D1: Price seems to be over extended since its very strong push up since UK parliamentary votes
H4: Price closed at weekly central pivot point with bullish engulfing pattern (expect potential rally to Month R3 before decline)
H4: 21 and 55 SMA converging for potential golden cross
H1: Price below moving averages in down trending order (21 < 55 < 144) which I see as technically bearish
H1: Bollinger Band beginning to contract, usually signifies expansion and increase in volatility is due

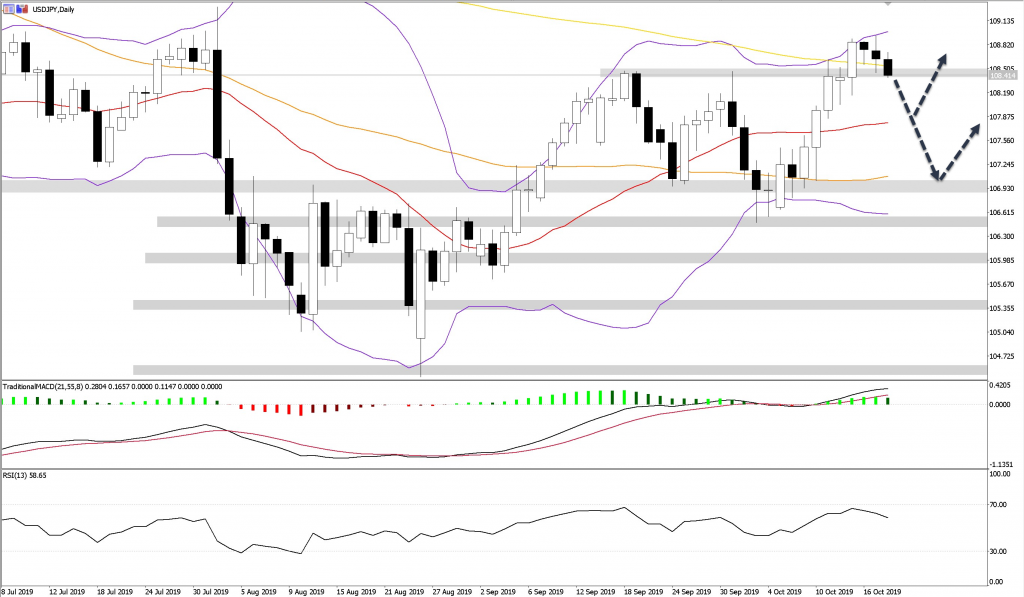
USDJPY – Bullish
WK1: Price trading above 21 SMA
WK1: Price has closed above 38.2% fib level
WK1: inverse head and shoulder pattern forming – lookout for break of neckline
D1: Price trading above 21/55/144 with 21/55 rising underneath price
D1: Price closed just above 50% fib level and has been consolidating just above with rounding bottom pattern
D1: 61.8% fib level serving as support – This area is also the weekly 50% fib
D1: 144 SMA serving as dynamic support
H4: Price above moving averages in up trending order (21 > 55 > 144) which I see as technically bullish
H4: Price consolidating above support
H4: Double bottom pattern formed at support area
H4: Bollinger Band beginning to contract, usually signifies expansion and increase in volatility is due


You must be logged in to post a comment.