All weekly Forex analysis are high-level and sets the week ahead. However markets change due to news and events so this may evolve. I do Monthly, weekly and daily scans every week for context. Higher TF help to guide the lower so as to give an indication or hint as to the direction of the market and potential entry points. I try to focus on price action and use indicators secondarily for probability of reversals or change in market sentiment.
Charts shown do not necessarily mean that I will be entering them, however I will observe for potential opportunities as they’re either a setup being played or about to be played.
Disclaimer: This is not financial advice but for educational purposes ONLY
My Approach:
First I look at my dashboard of the market to see any patterns of strength or correlation between pairs. Once I see a pair of interest, I look at it starting from Monthly to get sense of long term direction, then I move down timeframes towards M15. If I am interested in placing a trade, I open a M5 chart.
Chart Setup:
21 SMA = RED
55 SMA = ORANGE
144 SMA = GOLD
Bollinger Bands = PURPLE
MACD 21/55 (prefer to use in non-trending market)
RSI (prefer to use in non-trending market)
News
| Date | GMT 0 | Currency | Detail |
| Mon Oct 21 | |||
| Tue Oct 22 | 13:30 | CAD | Core Retail Sales m/m |
| 15:30 | CAD | BOC Business Outlook Survey | |
| Wed Oct 23 | 15:30 | USD | Crude Oil Inventories |
| Thu Oct 24 | 8:15 | EUR | French Flash Services PMI |
| 8:30 | EUR | German Flash Manufacturing PMI | |
| EUR | German Flash Services PMI | ||
| 12:45 | EUR | Main Refinancing Rate | |
| EUR | Monetary Policy Statement | ||
| 13:30 | EUR | ECB Press Conference | |
| USD | Core Durable Goods Orders m/m | ||
| Fri Oct 25 |
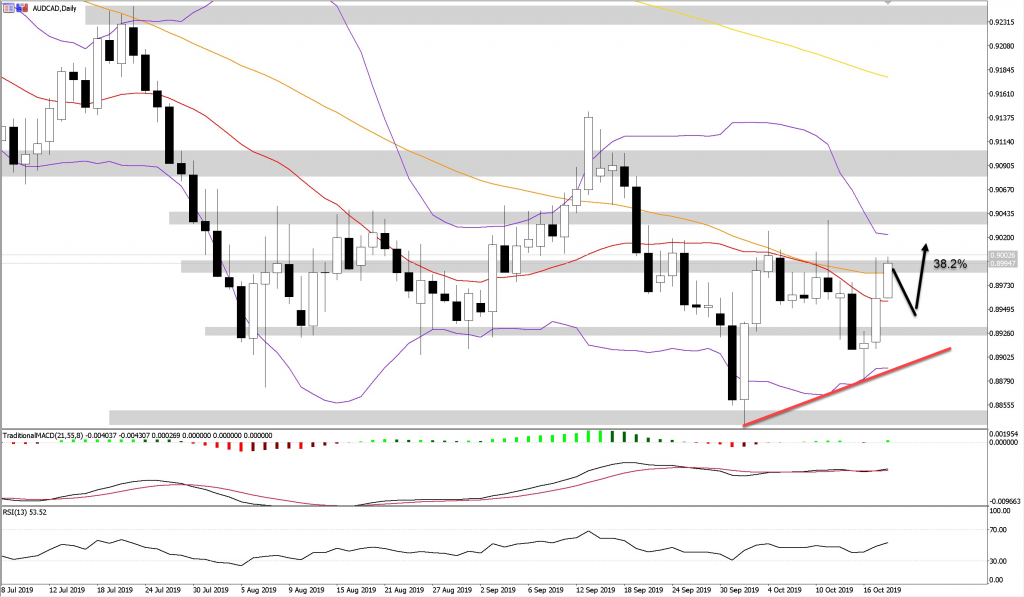
AUDCAD – Bullish
WK1: Price seems to be forming a base (consolidation) after a decline in price and ranging at lower levels as seen by long lower shadows (wicks)
D1: Price ended the week with a break above the 21 and 55 SMA
D1: Price making a higher high
D1: Price currently at 38.2 Fibonacci level expect pull back from this level before upward movement
D1: Bollinger Band beginning to contract, usually signifies expansion and increase in volatility is due
H4: Price at Monthly CPP and resisted up to four times, expect price decline before rally
H1: Price now above moving averages in up trending order (20 > 50 > 200) which I see as technically bullish

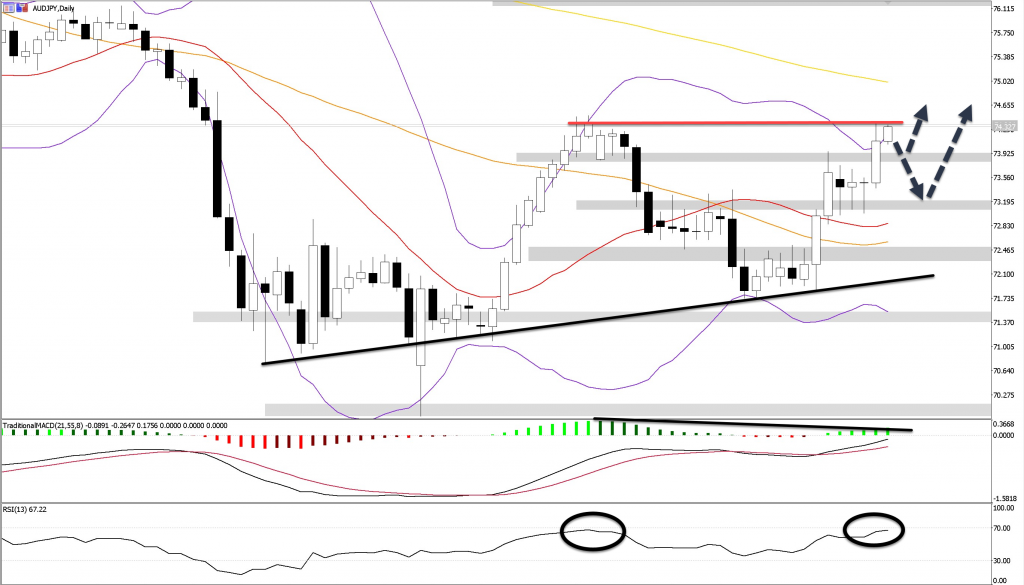
AUDJPY – Bullish
WK1: Price made higher low
WK1: Price currently closed at the 23.6 Fib level.. Expect pull back before proceeding upward
WK1: Price closed above 21 SMA
D1: Price at upper Bollinger Band, expecting potential decline
D1: Price closed above 61.8 fib level which was previous resistance area
D1: RSI at 70 similar to last resistance price
D1: Price trading above the 21 and 55 SMA
H4: Price now above moving averages in up trending order (20 > 50 > 200) which I see as bullish
H4: Negative divergence on price vs. MACD histogram, expect price decline
H1: Price now above moving averages in up trending order (20 > 50 > 200) which I see as bullish

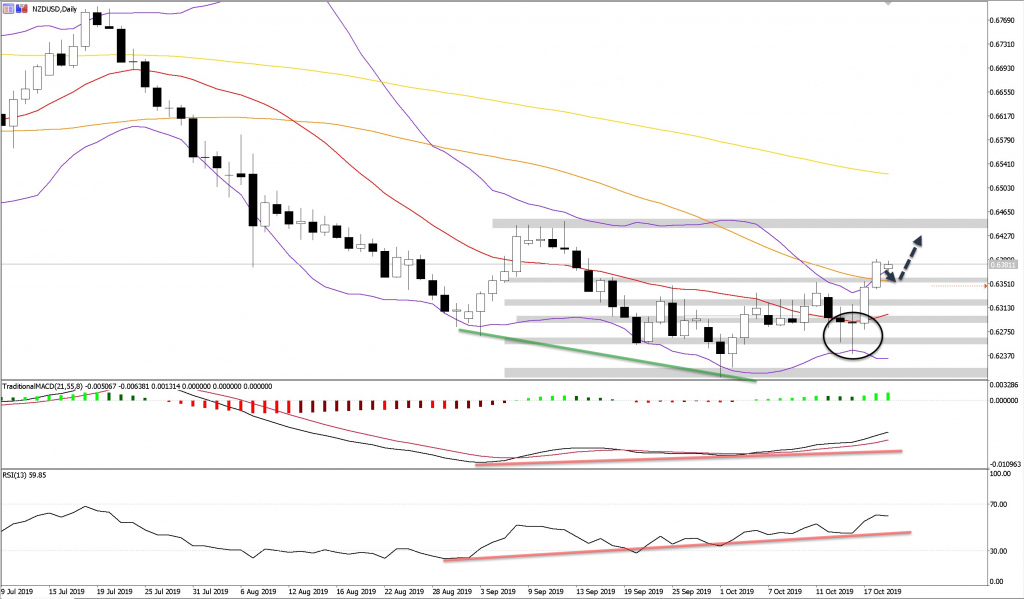
NZDUSD – Bullish
W1: Strong close above 21 SMA
W1: Strong closed at 23.6 fib level
D1: Price continuing upward after morning start candle pattern
D1: Price trading above the 21 and 55 SMA
D1: Price closed at 61.8% fib level – expect retrace before progressing upward
D1: Bollinger Band beginning to contract, usually signifies expansion and increase in volatility is due
H4: Price approaching monthly R1 and weekly R3 as potential resistance
H4: Look for retrace to around weekly CPP


You must be logged in to post a comment.