All weekly Forex analysis are high-level and sets the week ahead. However markets change due to news and events so this may evolve. I do Monthly, weekly and daily scans every week for context. Higher TF help to guide the lower so as to give an indication or hint as to the direction of the market and potential entry points. I try to focus on price action and use indicators secondarily for probability of reversals or change in market sentiment.
Charts shown do not necessarily mean that I will be entering them, however I will observe for potential opportunities as they’re either a setup being played or about to be played.
As per our disclaimer – This is not financial advice but for educational purpose
20 SMA = RED
50 SMA = ORANGE
200 SMA = YELLOW
Bollinger Bands = PURPLE
MACD (prefer to use in non-trending market)
RSI (prefer to use in non-trending market)
There is some news due this week that could affect the markets especially AUD and EUR so it would be wise to be cautious.
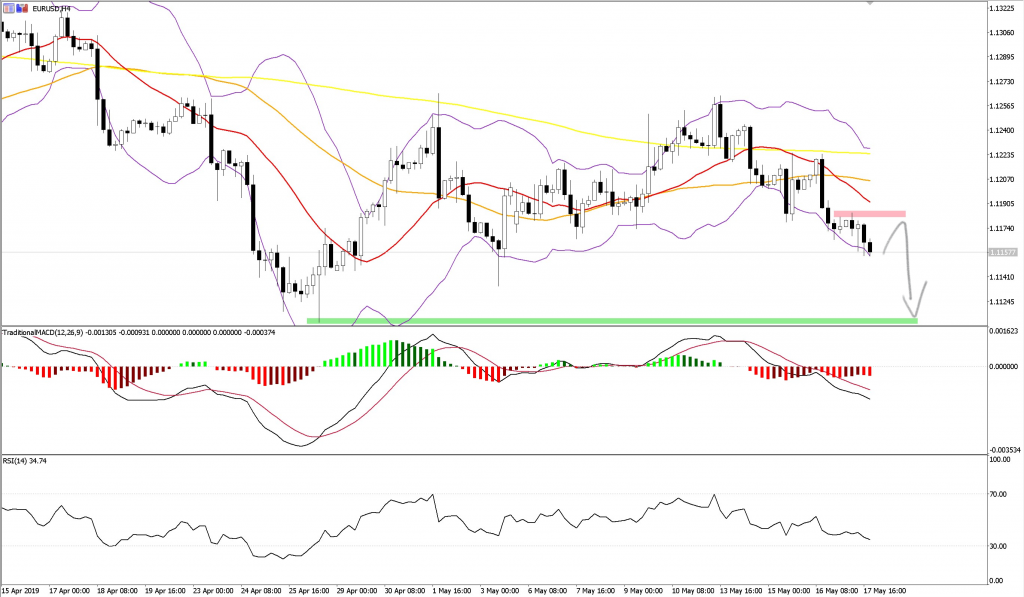
EURUSD – Bearish
Continuation from previous week – Moving averages in down trending order (20 < 50 < 200)
H4: Looking to short at pullback into the downtrend
D: MACD Cross under signal line

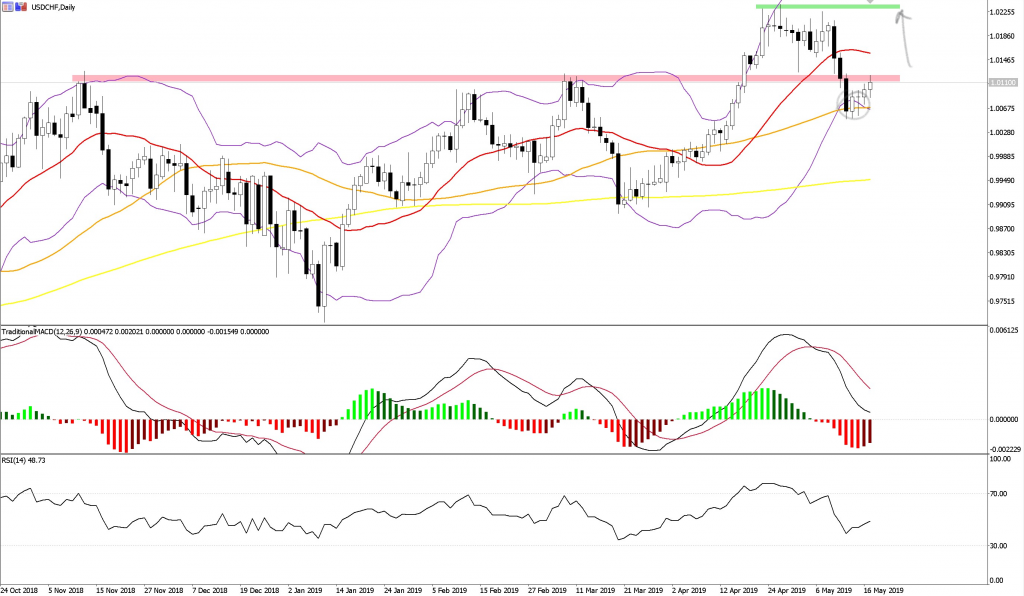
USDCHF – Bullish
W: Price above Moving Averages in up trending order (20 > 50 > 200)
W: Price closed with a hammer last week signifying rejection at the 20MA area
D: Price reacted to 50MA, with piercing line pattern, set stop just below
D: Price at bottom Bollinger Band
D: Price is at resistance, so await to see if there is a break above
H4: Price reacting to 20MA to the upside, however 50/200MAs above so as above, await to see if there is a break

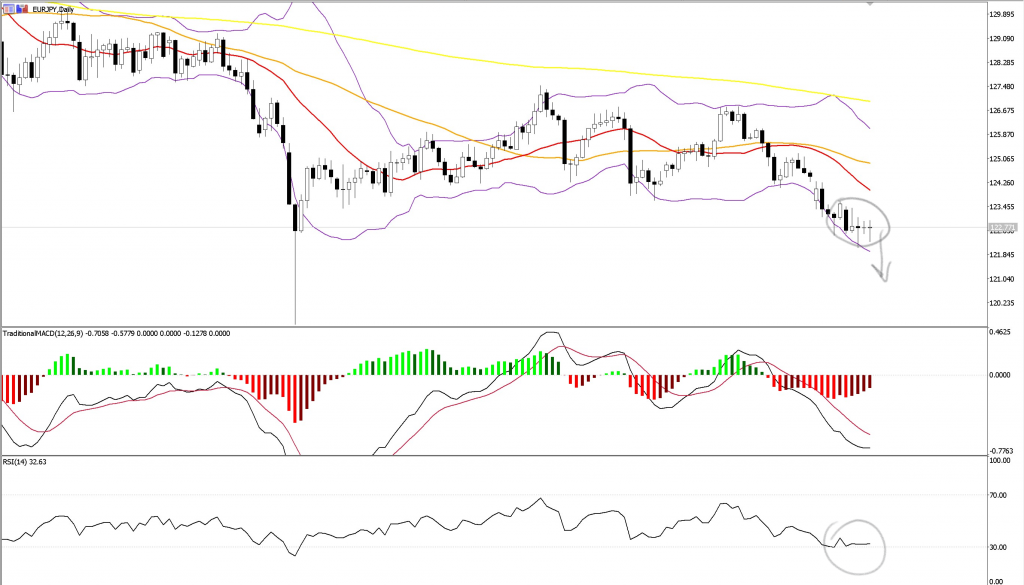
EURJPY – Bearish
Moving averages in down trending order (20 < 50 < 200) Looking to short at pullback into the downtrend
W: Price closed below downward gap, as well as last week’s doji
W: Price closed below 50% fib level from 2016 pivot low
D: Price undecided for last few days (3xdoji) This could point to relieve of selling pressure before moving further to the downside
D: RSI not signalling oversold conditions
D: No crossover indicated on MACD

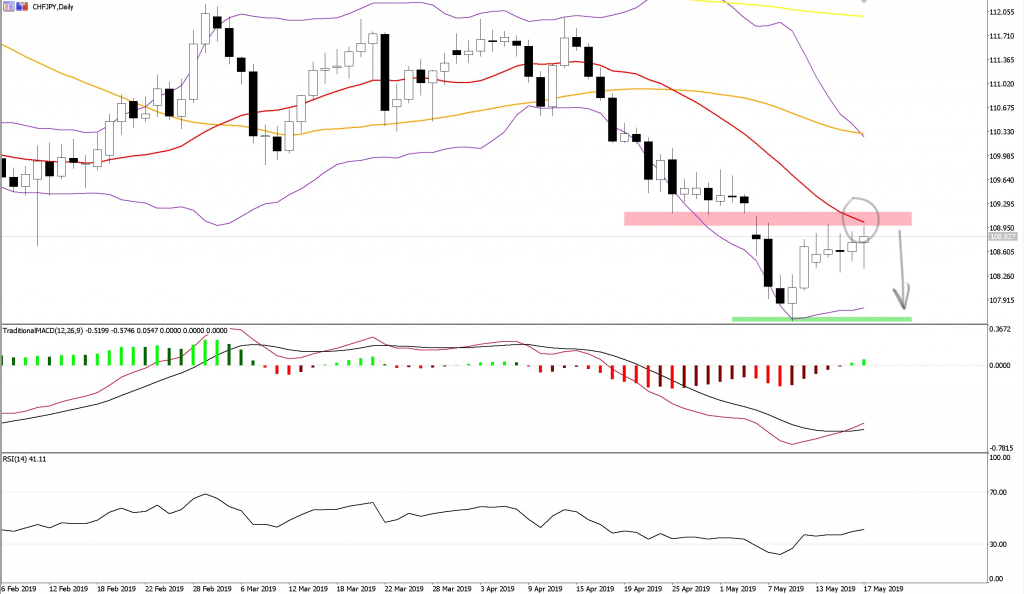
CHFJPY – Bearish
Moving averages in down trending order (20 < 50 < 200) Looking to short at pullback into the downtrend
W: Price unable to break above hammer made two weeks ago at strong potential resistance area,
W: Indicators not showing convincing reversal signals
D: Price at 20MA acting as potential resistance
D: Price at gap down acting as resistance
D: Price seems to be weakening as rose to resistance area
H4: Price at top of Bollinger Band and resistance area, previous bar showing long upper shadow


You must be logged in to post a comment.