All weekly Forex analysis are high-level and sets the week ahead. However markets change due to news and events so this may evolve. I do Monthly, weekly and daily scans every week for context. Higher TF help to guide the lower so as to give an indication or hint as to the direction of the market and potential entry points. I try to focus on price action and use indicators secondarily for probability of reversals or change in market sentiment.
Charts shown do not necessarily mean that I will be entering them, however will observe for potential opportunities as they’re either a setup being played or about to be played. As always, this is not financial advise and is only for educational purpose – Please refer to our disclaimer.
20 SMA = RED
50 SMA = ORANGE
200 SMA = YELLOW
Bollinger Bands = PURPLE
MACD (prefer to use in non trending market)
RSI (prefer to use in non-trending market)
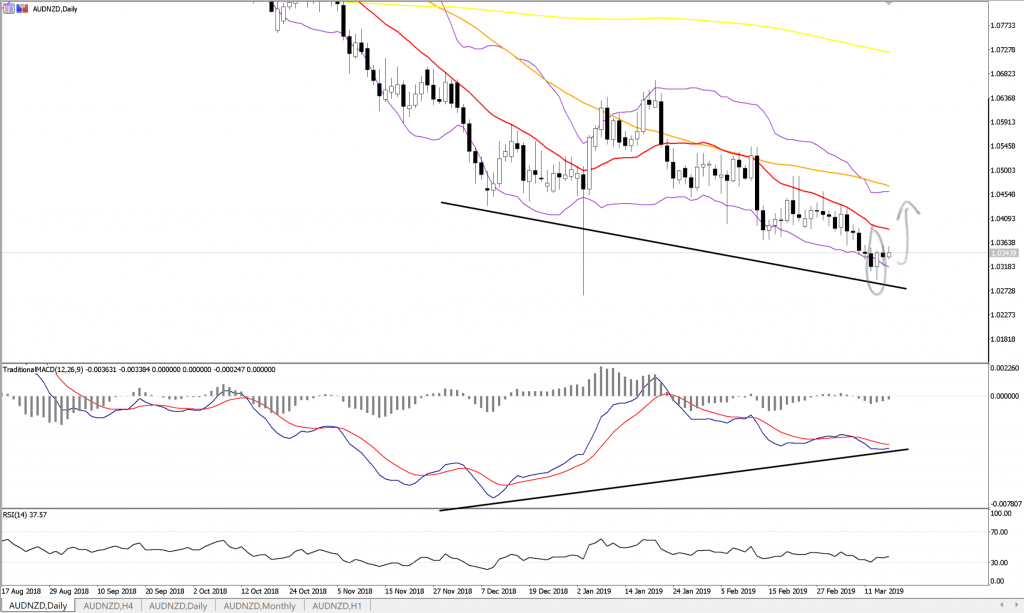
AUDNZD – Look for long positions
Potential reversal signal at support – Doji on weekly
WK: Doji with long lower shadow at support level reaching back to 2016
DY: Bullish engulfing pattern on 13/03 at support following similar bullish patterns at similar level at least since JUL 2016
DY: Bullish pattern appearing at bottom of Bollinger Band
DY: Positive divergence on MACD
H4: Price break above 20MA which was resistance now appearing as support

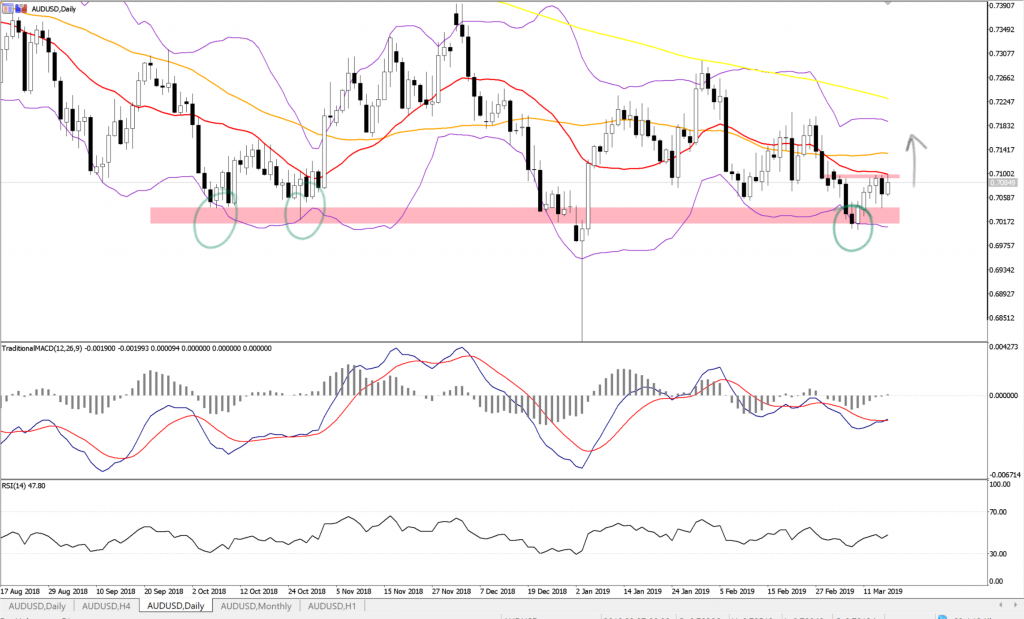
AUDUSD – Look for long positions
Potential reversal signal at support – Bullish piercing pattern on weekly
WK: Bullish pattern appearing at bottom of Bollinger Band and support area
WK: Lower lows to same lows – expect higher lows
WK: Positive divergence on MACD
DY: Potential pull back – I’d like to seek close above prior three sessions and above 20 SMA
H4: Price at resistance since beginning of MAR,
H4: Shooting star, inverse hammer, 2 dojis but price does not turn as well as above 20/50 MAs

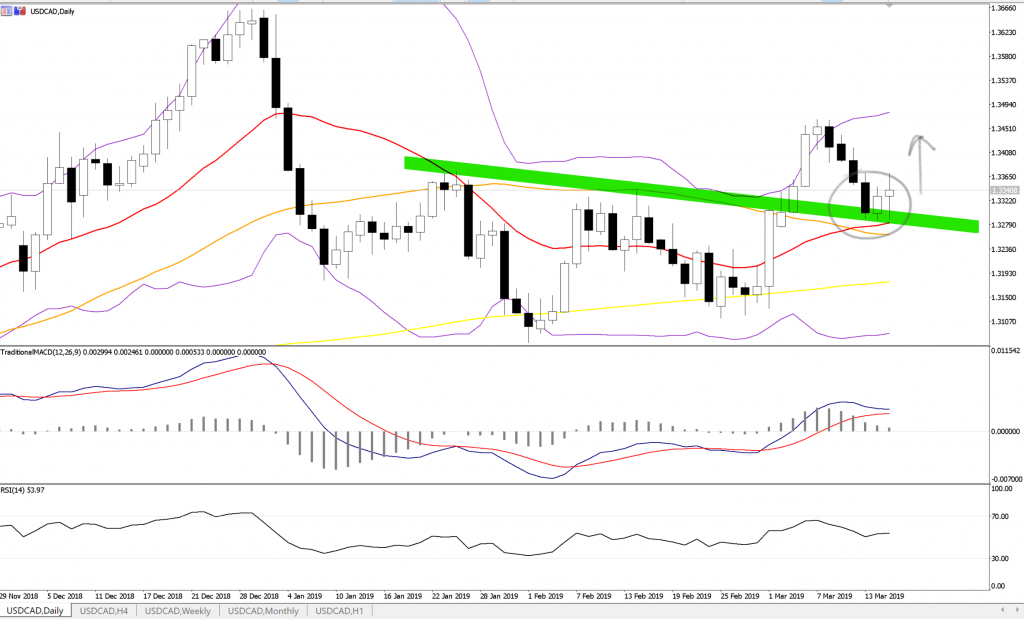
USDCAD – Look for long positions
Buy pull back of upward swing
WK: Upward trend – 20MA over 50 and 200MA
WK: Price bounce off 20MA
DY: Bullish engulfing pattern after downtrend
DY: Bullish engulfing pattern also appears at 20MA as support
DY: Bullish engulfing pattern also appears at bullish crossover of 20MA over 50MA
DY: Old support becomes new support
DY: Upward trend – 20MA over 50 and 200MA
H4: Double bottom pattern
H4: Price broken above 20MA
H4: Positive divergence on RSI
H4: MACD crossover signal


You must be logged in to post a comment.